Product introduction
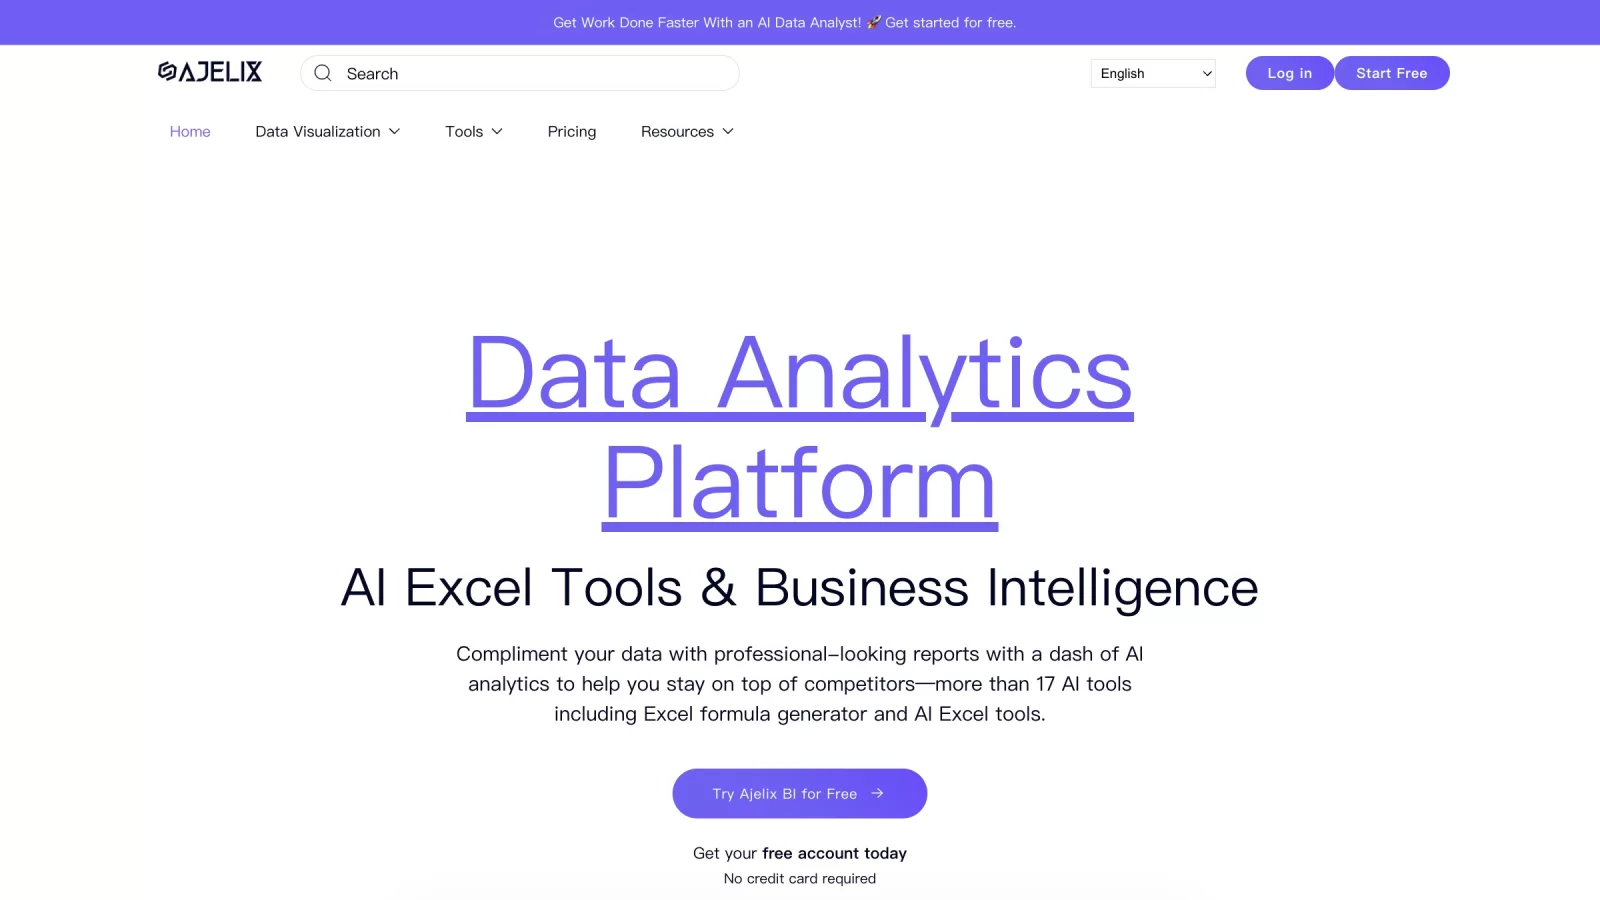
Ajelix is an intelligent data analysis and visualization platform that integrates artificial intelligence to lower the barrier to data processing and improve decision-making efficiency. Its core advantage lies in a built-in suite of AI-driven tools that seamlessly connect with Excel, Google Sheets, and various databases, automating tedious tasks such as formula generation, data cleaning, and structured conversion. Through natural language interaction and automated report generation, Ajelix helps analysts, managers, and general users transform complex data into intuitive dashboards and charts, enabling rapid insights into business value.
Beyond its powerful data processing engine, Ajelix offers comprehensive Business Intelligence (BI) capabilities, supporting real-time connections to multiple data sources for deep analysis. Whether handling daily data organization or building enterprise-level monitoring dashboards, users can leverage its AI assistant for efficient collaboration and instant insights, making data-driven decision-making simpler and more intuitive.
Key Features
- AI-Enhanced Spreadsheet Tools: Provides smart formula generation, cross-language data translation, and automated data cleaning, significantly boosting efficiency in Excel and Google Sheets.
- Interactive AI Analysis Assistant: Supports querying data through conversational interfaces, using AI technology to uncover underlying logic and business insights within the data.
- Comprehensive Data Preprocessing: Features robust data formatting, restructuring, and filtering capabilities compatible with SQL functions, capable of handling complex data cleaning tasks.
- Flexible BI Dashboards: Supports data ingestion from multiple sources (such as Excel and SQL databases), automatically generating visual charts and KPI indicators with support for real-time updates.
- Secure Collaboration & Report Sharing: Offers convenient link sharing mechanisms, including password protection and email collaboration features, ensuring data security while facilitating team communication.
Use Cases
- Real-Time Enterprise Operations Monitoring: Build comprehensive operational dashboards to track core business metrics like sales volume and customer traffic, providing a clear overview of business status.
- Human Resources Efficiency Analysis: Quantify key dimensions such as recruitment cycles and labor costs through hiring process dashboards to optimize talent acquisition strategies.
- Financial Health Monitoring: Establish financial accounting views to monitor cash flow dynamics, profit and loss situations, and budget execution progress in real time.
- IT Project Performance Management: Utilize IT-specific KPI dashboards to evaluate project delivery progress, resource utilization, and overall departmental performance.
- Vertical Industry Business Insights: Suitable for specific industries like insurance and leasing, enabling deep analysis and trend prediction of industry-specific metrics such as customer acquisition costs, equipment utilization, and return on investment.