Product introduction
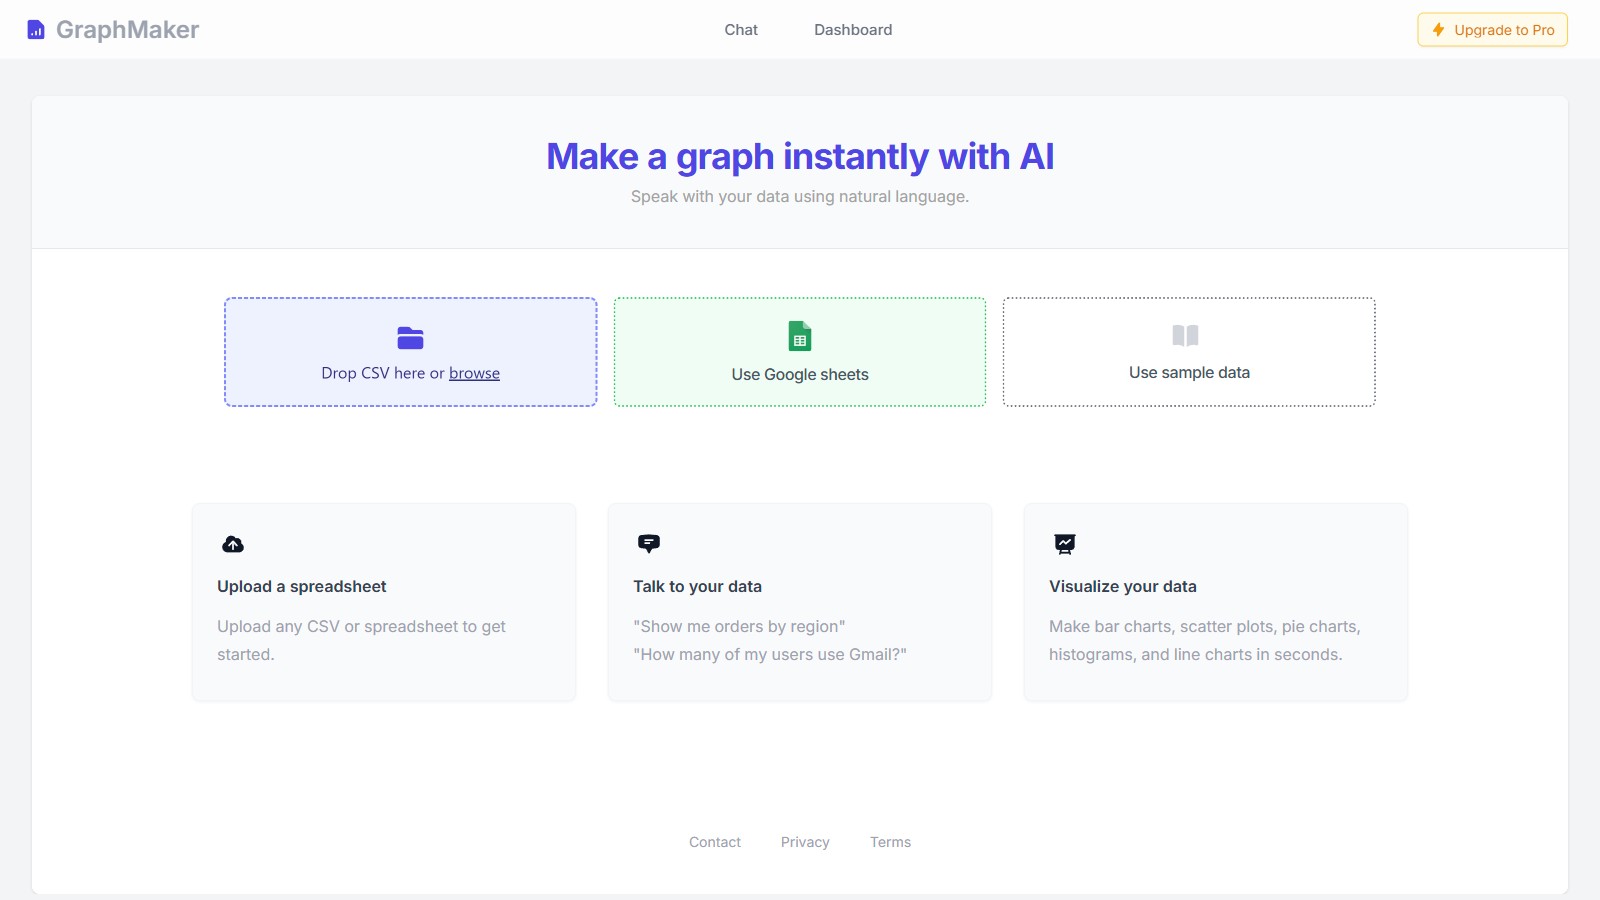
GraphMaker is an AI-driven data visualization tool designed to simplify the chart creation process through natural language interaction. Users can upload CSV or Excel spreadsheets and provide text descriptions of their desired chart types or analysis needs, allowing the system to automatically parse instructions and generate visualizations such as bar charts, pie charts, and scatter plots. The tool emphasizes data privacy, committing not to store any uploaded user data.
With its intuitive conversational interface, GraphMaker quickly transforms complex data into easy-to-understand visual formats. It supports post-generation editing, including axis adjustments, legend modifications, and style enhancements, before exporting results as images or PDF files. It is ideal for professionals in business reporting, academic research, and daily data exploration who need to rapidly present analytical findings.
Key Features
- Natural Language Driven: Supports describing data requirements in everyday language (e.g., "Show sales by region"). The system automatically identifies intent and generates the corresponding chart.
- Multi-Format Compatibility: Allows uploading CSV files or Excel spreadsheets as data sources, facilitating integration with existing workflows.
- Comprehensive Chart Library: Covers mainstream visualization types including bar charts, pie charts, scatter plots, line charts, and histograms to meet diverse data display needs.
- Interactive Editing: Offers flexible post-generation editing features, such as adjusting axis ranges, modifying legend labels, and adding data annotations, ensuring charts accurately convey data meaning.
- Customizable Styling: Includes various customization options, supporting custom color schemes and font styles to enhance the professionalism and readability of charts.
- Secure Data Handling: Prioritizes user privacy with a clear commitment not to store uploaded data, ensuring information security.
Use Cases
- Business Decision Support: Quickly create sales reports, financial analyses, and market trend charts to help management intuitively grasp business dynamics.
- Academic Research & Teaching: Assists researchers and students in converting experimental data and statistical analysis results into standard charts for paper writing or classroom presentations.
- Data Journalism: Enables media professionals to transform large datasets into accessible infographics, enhancing the persuasiveness and reach of news reports.
- Market Strategy Development: Analysts use visualization tools to gain deep insights into consumer behavior and competitive landscapes, aiding in the formulation of precise marketing plans.
- Project Progress Management: Project managers use timelines, resource allocation charts, and other visual methods to clearly track project milestones and execution status.