Product introduction
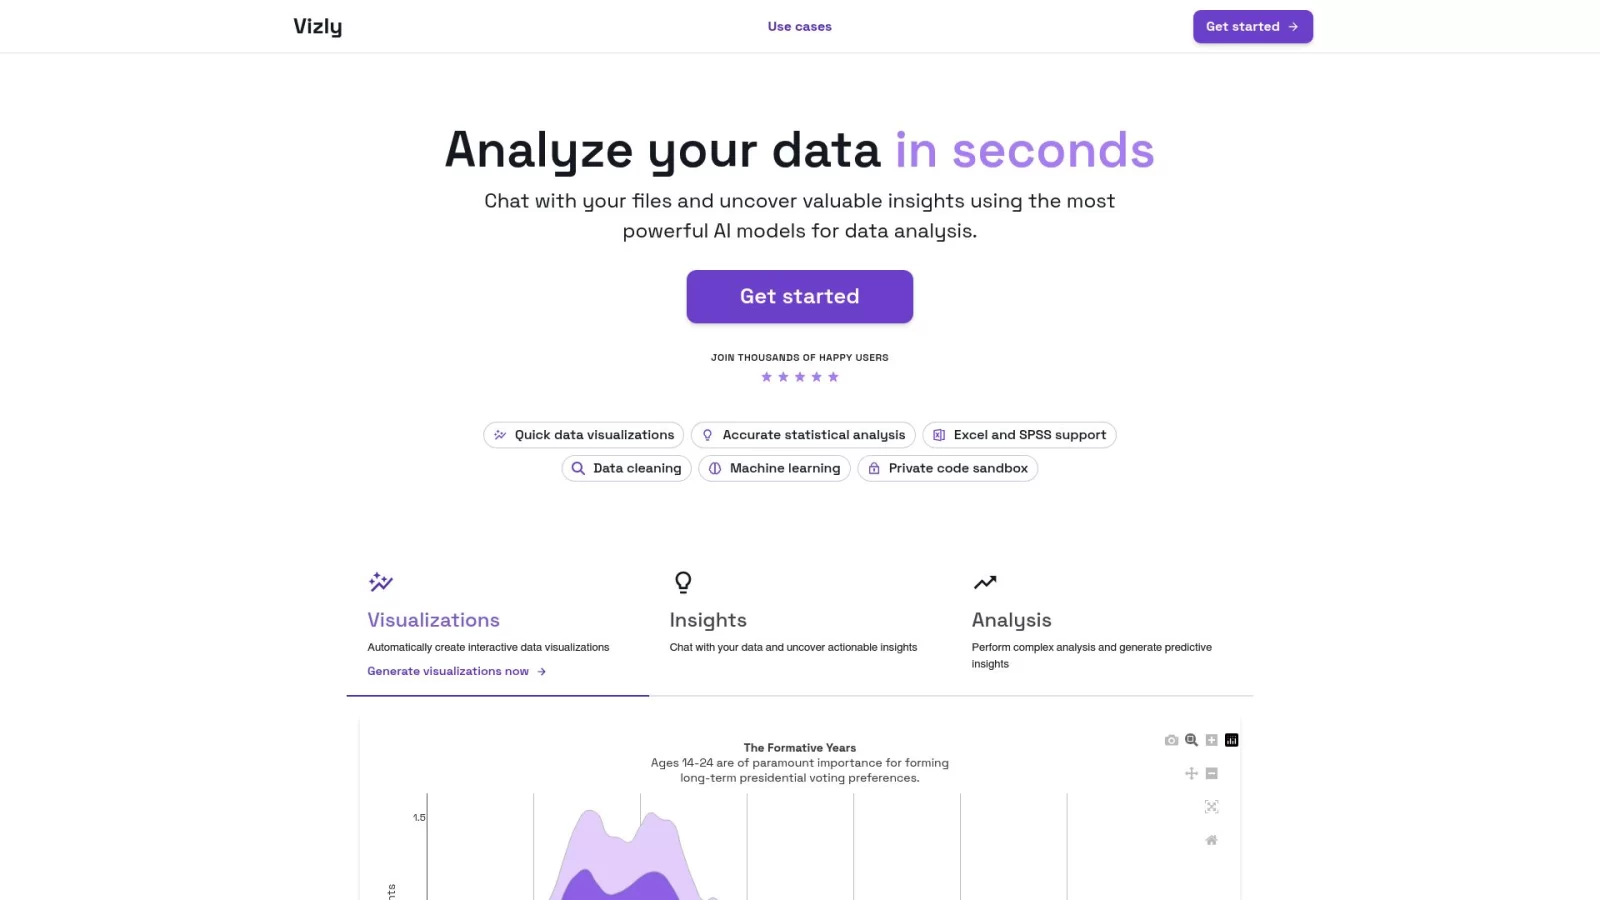
Vizly AI is an intelligent data analysis platform built on artificial intelligence, designed to break down the technical barriers of data processing. It allows users to communicate directly with the system through natural language interactions similar to everyday conversation, completing the entire process from data extraction and cleaning to deep insights. Whether for business decision support, academic research, or personal project exploration, Vizly AI helps users quickly transform raw data into actionable strategic recommendations.
The core value of this tool lies in its high ease of use and broad compatibility. Users do not need to master programming languages like Python or R, nor do they require a deep background in statistics; simply entering simple instructions triggers complex data processing workflows. Vizly AI can automatically parse information from Excel, CSV, JSON, PDF, and even image files, instantly generating intuitive interactive charts and advanced analysis results such as regression and correlation, significantly improving work efficiency and making data-driven decisions accessible.
Key Features
- Multi-source Heterogeneous Data Compatibility: Equipped with a powerful data parsing engine, it supports seamless import of various formats including Excel, CSV, JSON, PDF documents, and images, eliminating tedious format conversion steps and enabling rapid integration and analysis of cross-source data.
- Natural Language Intelligent Interaction: Utilizing advanced AI large model technology, users can issue analysis commands through colloquial questions. The system automatically understands intent and executes corresponding data processing tasks, allowing non-technical users to easily obtain data insights like experts.
- Interactive Visual Presentation: Automatically generates diverse charts such as bar charts, line charts, and scatter plots based on analysis needs. Supports interactive operations like zooming and filtering, helping users more intuitively and deeply explore trends and anomalies behind the data.
- Advanced Statistical Analysis and Prediction: Beyond basic display, it can execute complex algorithms including correlation analysis, regression analysis, and time series prediction, providing users with deep insights and forward-looking predictions based on data patterns.
- Code Transparency and Multi-format Export: Automatically generates corresponding Python or R analysis code in the background for user review and learning, while supporting one-click export of final reports and charts to PDF, Word (.docx), HTML, or Jupyter Notebook (.ipynb) formats, facilitating reporting and sharing.
Application Scenarios
- Marketing Optimization: Marketing teams can use it to analyze advertising effectiveness, user behavior trajectories, and channel acquisition costs, precisely identifying high-conversion channels and formulating personalized marketing strategies to improve return on investment.
- Financial Risk Control Assessment: Financial institutions can leverage it to process customer credit scores, repayment records, and market volatility data, building risk models to predict default probabilities and optimize risk management strategies for investment portfolios.
- Medical and Health Research: Researchers can quickly process patient medical records, genetic data, and clinical trial results, assisting in discovering disease causation patterns, evaluating drug efficacy and safety, and accelerating medical research progress.
- Personalized Education Tutoring: Teachers can analyze student grade distributions, homework completion rates, and learning behavior data to identify groups with learning difficulties, thereby formulating targeted teaching interventions and personalized tutoring plans.
- Enterprise Operational Efficiency: Managers can monitor key indicators such as sales, inventory, and finance in real-time, analyzing profit margins and inventory turnover rates to optimize supply chain management and product mix, enhancing overall operational efficiency and profitability.