Product introduction
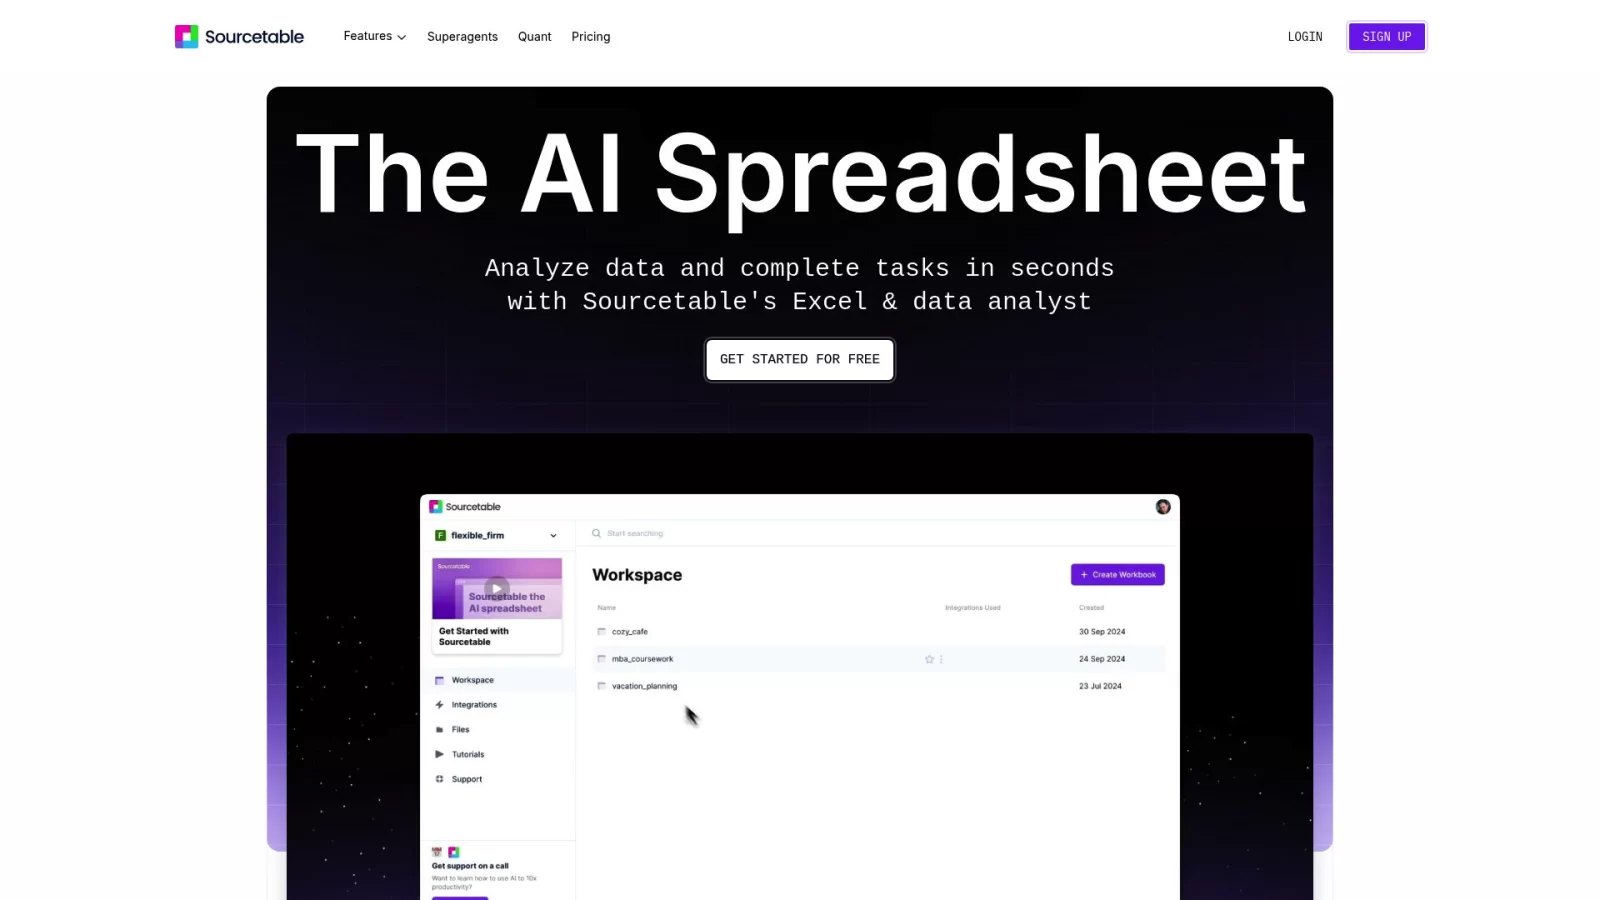
Sourcetable is an AI-integrated spreadsheet and data analysis platform designed to transform data processing by lowering technical barriers. It seamlessly combines the intuitive interface of traditional spreadsheets, ChatGPT-level natural language interaction, and a powerful Python backend engine, enabling users to perform efficient data operations without mastering complex code or formulas.
The platform supports connections to various data sources, using an AI assistant to automate data cleaning, transformation, and deep insight mining. Whether for business decision-makers, researchers, or general users, its intelligent features enable rapid generation of visual charts and reports, allowing users to focus on extracting core value from data and improving overall efficiency and decision quality.
Key Features
- Intelligent AI Assistant: An embedded expert-level AI agent instantly responds to requests for formula writing, data cleaning, and complex analysis, providing a professional analyst experience that significantly boosts processing efficiency.
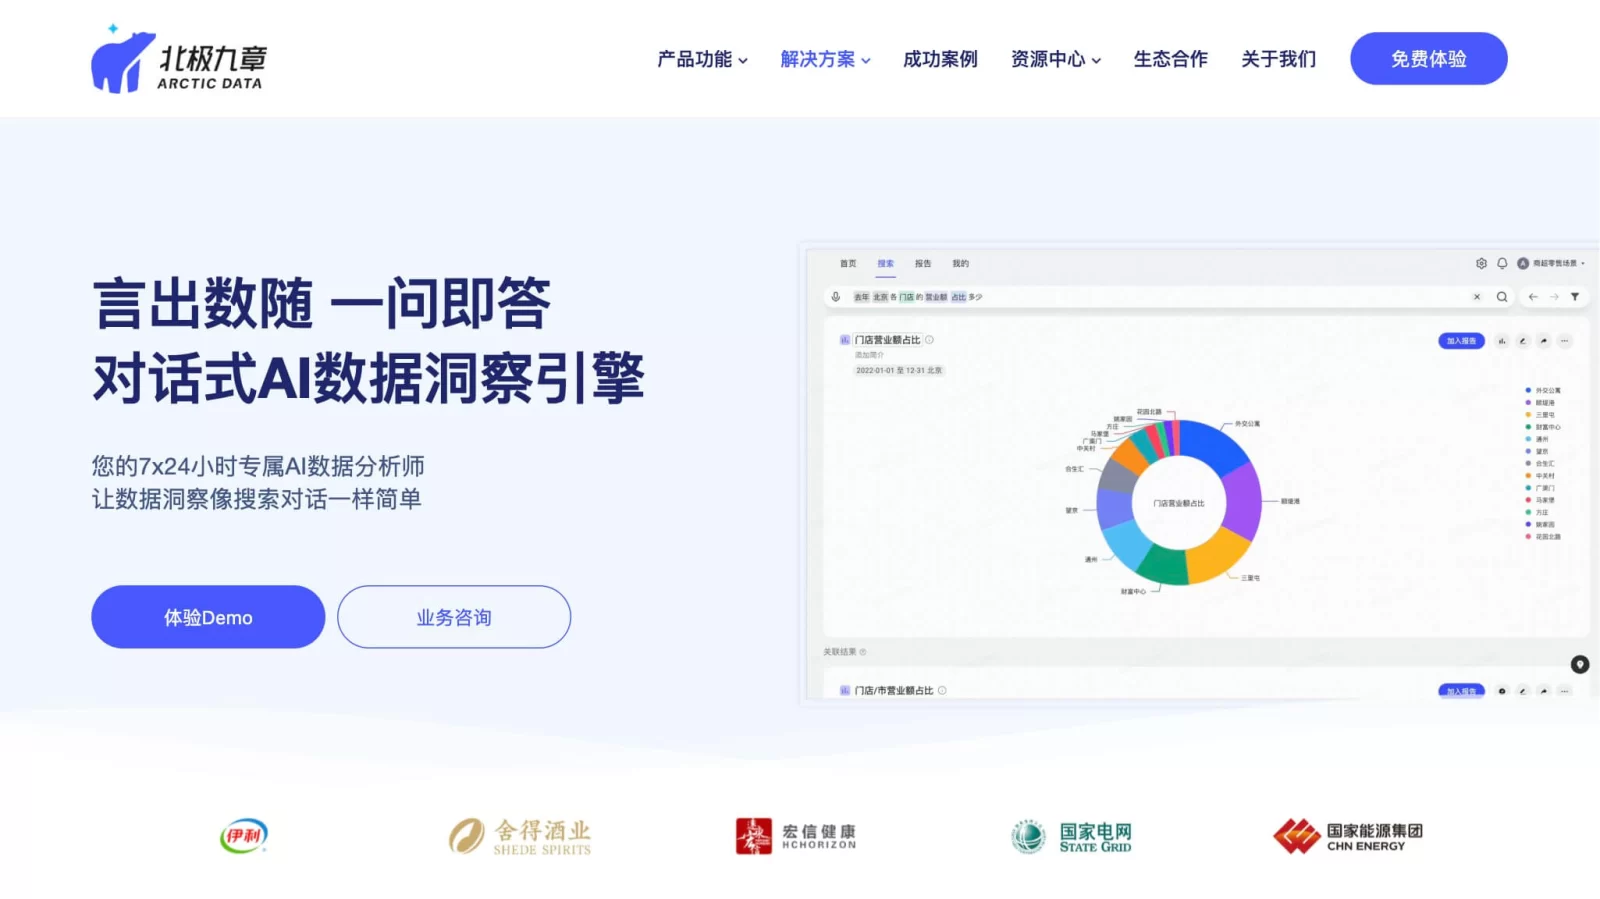
- Natural Language Querying: Supports querying data using everyday language, such as asking about specific metrics or trends. The system automatically parses intent and returns precise answers, eliminating the need to write SQL or complex query statements.
- Automated Chart Generation: Simply describe the desired visualization (e.g., "show a bar chart of monthly sales"), and the AI generates beautiful, interactive charts with one click, facilitating rapid data visualization.
- Deep Data Mining: Uses AI algorithms to deeply analyze correlations and potential patterns within data, helping uncover hidden business opportunities and providing multi-dimensional insights for data-driven decisions.
- Quick Command Bar: Provides a natural language instruction input box where users can execute data processing tasks like removing duplicates or converting date formats through simple commands, simplifying the workflow.
- Smart Template Creation: Automatically creates spreadsheet templates with preset formulas and formatting based on text descriptions (e.g., "sales report template"), ensuring data standardization and consistency.
Use Cases
- Finance & Investment Analysis: Assists financial professionals in building financial models, quickly identifying market trends and risks, and automatically generating reference reports for investment decisions to optimize asset allocation strategies.
- Marketing Effectiveness Evaluation: Helps marketing teams analyze campaign ROI and customer behavior data, identify high-conversion channels, predict churn risks, and formulate more precise personalized marketing plans.
- Data Science & Modeling: Accelerates data preprocessing and statistical analysis processes, automatically recommends suitable algorithms, and generates evaluation reports, shortening the development cycle for data science projects.
- Enterprise Business Intelligence: Transforms scattered business metrics into actionable insights, automatically generates KPI monitoring reports, and supports management in making confident and rapid strategic adjustments.
- Academic & Scientific Research: Assists researchers in processing experimental data, automatically performs statistical tests, and generates scientific charts, revealing key patterns and trends in research results.
- Educational Administration: Empowers teachers to automate homework grading, generate student performance analysis reports, and provide personalized learning path suggestions, enhancing teaching feedback efficiency.