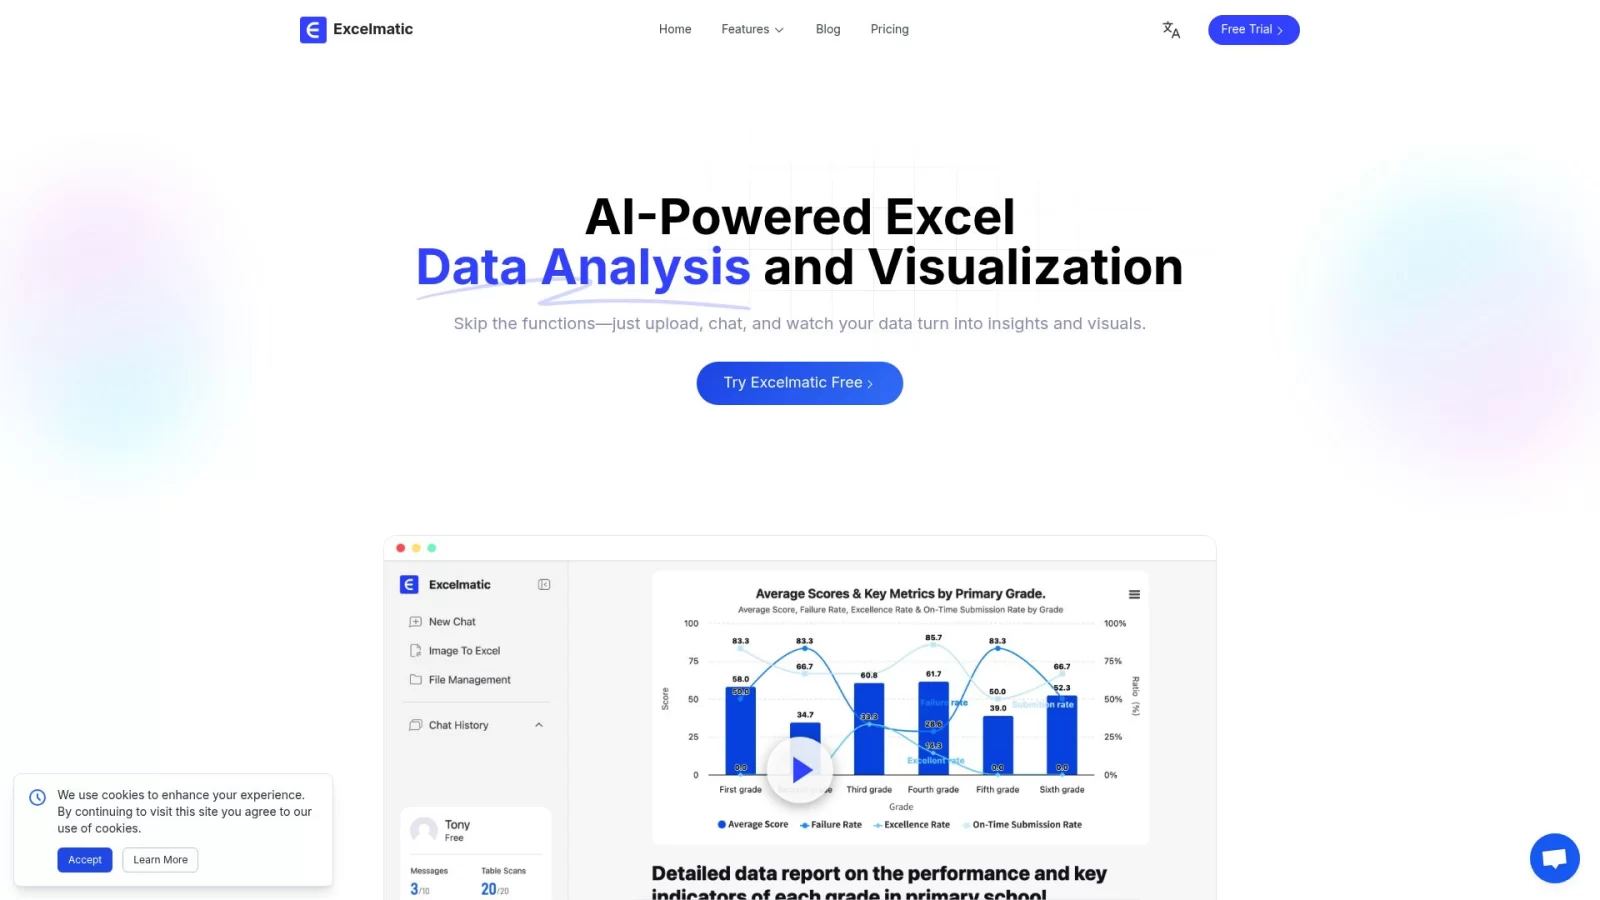
Product introduction
Excelmatic is an online spreadsheet assistant powered by artificial intelligence, designed to lower the barrier to entry for Excel and enable non-technical users to efficiently complete data processing tasks. It leverages natural language processing to translate everyday user commands into executable Excel operations, covering core areas such as data cleaning, analysis, visualization, and business intelligence. This helps users free themselves from tedious formula writing and focus on uncovering the value of their data.
As an AI-driven intelligent assistant, Excelmatic not only accurately understands user intent but also provides smart data suggestions. Whether organizing messy data sources or quickly generating business insights, the tool significantly improves work efficiency, supporting end-to-end automation from raw data to final reports.
Key Features
- Natural Language Interaction: Through a conversational interface, users can execute data cleaning, splitting, merging, and other operations simply by describing their needs. The system automatically generates updated Excel files without requiring knowledge of complex functions.
- Intelligent Data Analysis: Equipped with powerful statistical computing capabilities, it automatically identifies data patterns, calculates descriptive statistics such as averages and medians, and performs trend and correlation analysis to reveal underlying data trends.
- Automated Chart Generation: Supports intelligent recommendation and generation of visual charts such as bar charts, line charts, and pie charts based on data types. Users can customize styles like colors and fonts to intuitively present data results.
- Business Intelligence Insights: Provides advanced report generation, predictive analytics, and decision support features, suitable for scenarios such as sales forecasting, KPI tracking, and scenario simulation, helping enterprises formulate business strategies.
- Image to Spreadsheet: Supports automatic recognition and conversion of table content from screenshots or scans in formats like PNG, JPG, and WebP into editable Excel workbooks, greatly simplifying the data entry process.
Use Cases
- Sales Performance Tracking: Quickly summarize monthly or quarterly sales data, automatically calculate key metrics such as growth rates, and generate visual reports, helping teams clearly grasp market dynamics.
- Financial Budget Planning: Use statistical methods like linear regression to predict future financial trends, providing reference data such as confidence intervals to assist management in optimizing investment and budget allocation.
- Operational Performance Monitoring: Automatically calculate core performance indicators such as ROI and CAC through simple commands and display them in dashboard format, reflecting the company's operational health in real-time.
- Marketing Effectiveness Evaluation: Analyze the correlation between advertising spend and revenue, generate intuitive comparison charts, and provide data support for optimizing marketing strategies.
- Presentation Creation: Directly generate style-consistent charts from spreadsheets for reporting and presentations, enhancing the professionalism and appeal of data presentation.