Product introduction
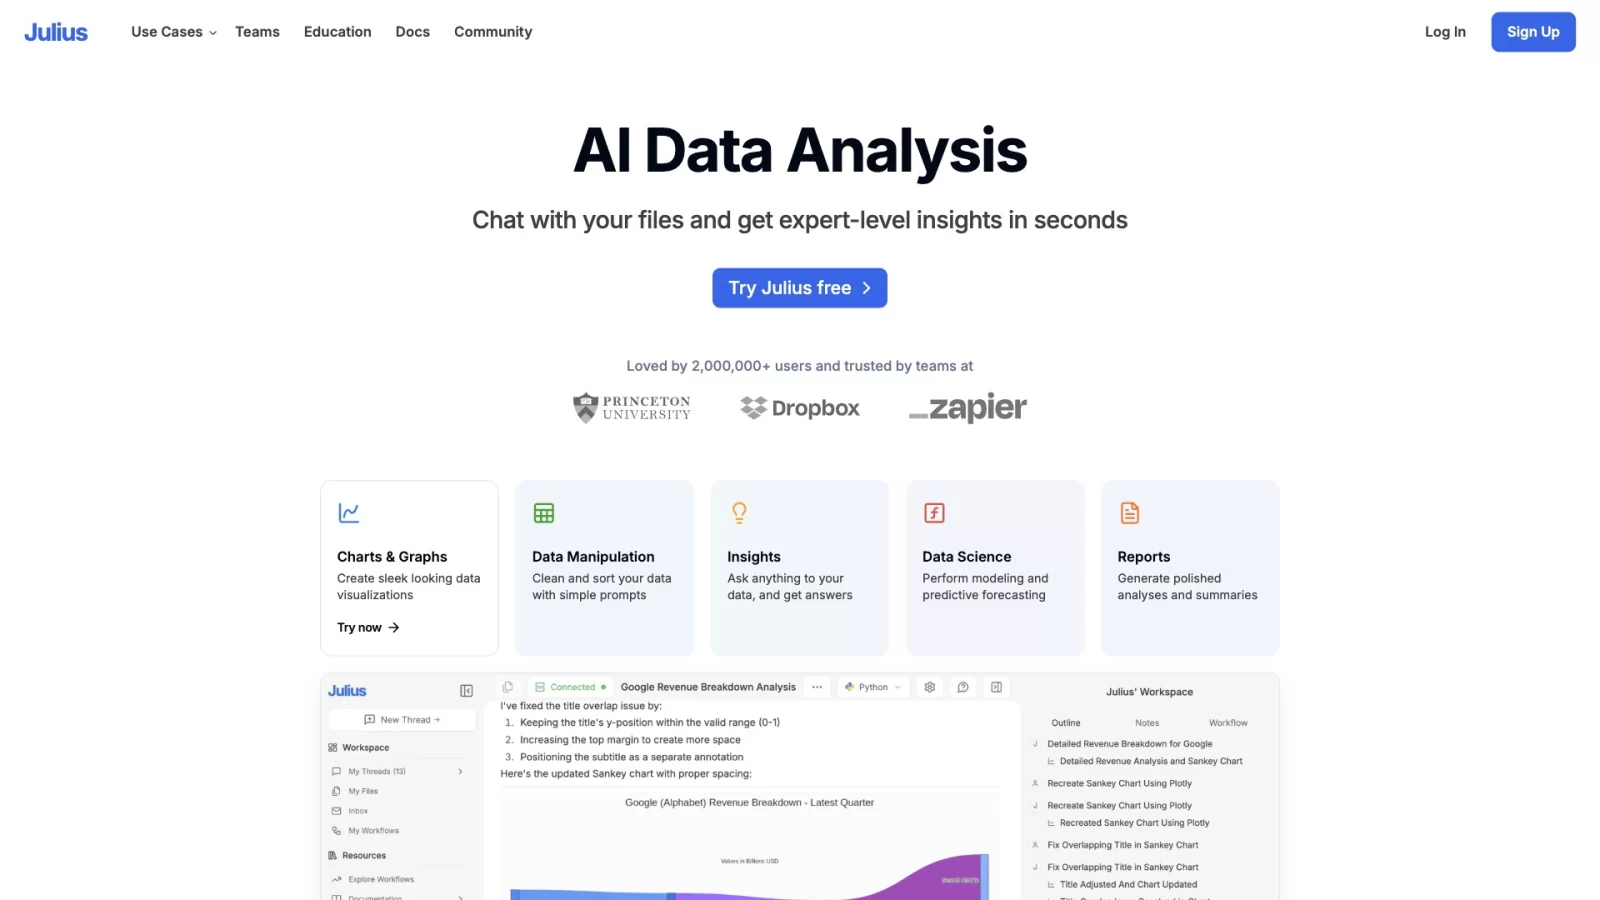
Julius AI is an intelligent analytics platform that deeply integrates natural language processing with data science. It breaks the traditional reliance on programming skills for data analysis, allowing users to directly mine data from files in formats such as Excel, CSV, and PDF through everyday conversation. Powered by a robust underlying language model, Julius AI automatically generates and executes Python code in the background, completing the entire workflow from data cleaning and statistical modeling to advanced visualization.
The platform's core value lies in significantly lowering the barrier to data insights. Whether for business professionals or researchers, there is no need to master complex coding logic; simply stating clear analytical requirements yields complete reports containing charts, tables, and textual interpretations. This intelligent workflow not only improves data processing efficiency but also enables non-technical users to easily handle complex data analysis tasks.
Key Features
- Natural Language-Driven Code Execution: Supports users initiating analysis requests with colloquial commands. The system automatically writes, runs, and debugs Python code to perform complex operations such as data cleaning, regression analysis, and predictive modeling.
- Multi-Source Heterogeneous Data Compatibility: Seamlessly connects with various file formats including Excel, CSV, Google Sheets, and PDF documents, accurately extracting table data from documents for structured processing.
- Intelligent Visualization and Dynamic Display: Built-in rich plotting engines automatically generate static charts such as line graphs, scatter plots, and bar charts based on analysis results. It even supports creating dynamic animations to intuitively present data evolution trends.
- Context Awareness and Iterative Analysis: Features conversation memory capabilities, supporting follow-up questions and multi-round exploratory analysis based on previous results. Provides notebook template functionality for reusing and standardizing analysis workflows.
- Low-Barrier Interactive Experience: Utilizes a simple and intuitive chat-based interface design, encapsulating complex data science backend logic to ensure that zero-basis users can quickly get started and complete professional-grade analysis.
Application Scenarios
- Business Market Insights: Marketing teams can use it to quickly integrate sales records and user behavior data, automatically generating user profiles, evaluating advertising ROI, and predicting future market trends to assist in formulating precise strategies.
- Academic Research Assistance: Researchers can upload experimental datasets to efficiently complete data cleaning, hypothesis testing, and chart drawing using the tool, significantly shortening the preparation cycle from raw data to paper publication.
- Financial Quantitative Research: Analysts can import historical stock prices or financial statements to conduct risk assessment, factor analysis, and predictive model building, obtaining professional quantitative analysis support without manually writing algorithms.
- Enterprise Operations Optimization: Operations departments can regularly upload production or logistics data to quickly identify bottleneck links and abnormal fluctuations in business processes, driving data-driven decision optimization.
- Programming Skills Learning: For beginners, this tool serves as a practical platform for learning Python data analysis. By observing the AI-generated code logic, users can understand best practices and methodologies for data processing.