Product introduction
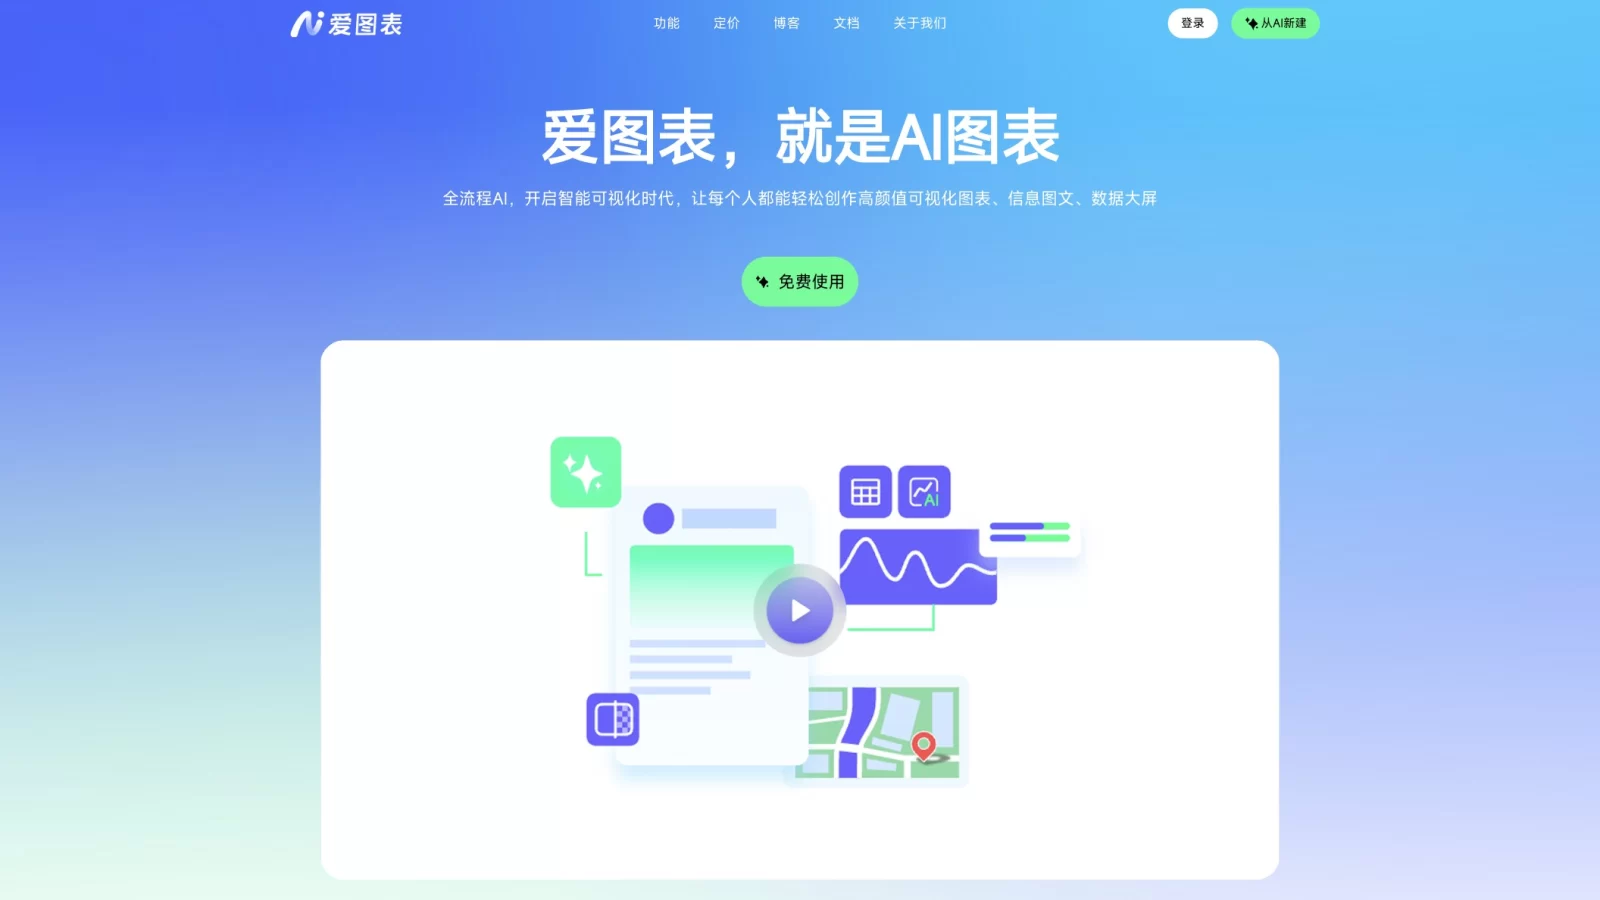
Ai Chart, developed by Wuhan Di Dimension Data Technology Co., Ltd. (the developer of Di Data Charts), is an online tool that integrates AI-driven design with data analysis. The platform deeply incorporates artificial intelligence to create a one-stop workflow for data processing, chart generation, report writing, and image editing, helping users efficiently produce professional-grade data visualizations.
The system supports diverse data import methods, features a vast library of exquisite templates and assets, and includes a powerful custom editing engine. Whether handling complex data analysis or detailed design layout tasks, users can leverage its AI-assisted features to significantly enhance creativity efficiency and content quality, meeting business needs across various scenarios.
Key Features
- Smart Chart Construction: Supports uploading local data or using sample data, automatically matching the best chart type via AI algorithms. It offers one-click switching among multiple professional color schemes and allows deep customization to ensure charts align with personal aesthetics.
- AI Text Assistance: Integrates smart text continuation, summarization, rewriting, and Chinese-English translation capabilities. This quickly optimizes and generates copy, particularly useful for accelerating the creation of data analysis reports.
- Image Generation & Processing: Enables generating exclusive image assets from text descriptions and provides intelligent background removal, lossless upscaling, cropping, filter application, and transparency adjustment to enrich visual expression.
- Vast Template Resources: Features a rich and aesthetically pleasing library of chart templates. Users can directly select and fine-tune them without starting from scratch, significantly shortening project production cycles.
Application Scenarios
- Business Analysis & Reporting: Helps market researchers and data analysts transform dry data into intuitive charts, quickly generating high-quality analysis reports to enhance the professionalism of data presentation.
- Presentation Creation: Ideal for corporate executives and sales teams to embed beautiful charts and design assets into PPTs, posters, and other commercial display materials, enhancing visual impact and persuasiveness.
- Educational & Research Support: Teachers and students can use it to create courseware, organize academic reports, and present research data in more concrete ways.
- Creative Design Prototyping: Designers can use blank canvases combined with AI-generated images and charts to quickly build design prototypes, sparking creative inspiration and improving iteration speed.
- Personal Knowledge Management: Individual users can utilize it for organizing study notes, visualizing personal project data, and building knowledge management systems to improve daily learning and work efficiency.